


Tunnel CFD Report


INTRODUCTION
In this study, the tunnel located in the city of Vlorë, Albania, designed by Hill International, was examined. The tunnel is two-lane and bidirectional, serving with one lane for each direction. The location of the tunnel is outside the city, and the expected traffic capacity generally consists of low-density traffic flow. For the ventilation of the tunnel, a longitudinal ventilation method was designed by placing jet fans at certain intervals along the tunnel.In this study, computational fluid dynamics (CFD) simulation was used to simulate the operation of the ventilation system under a specified scenario in the event of a fire inside the tunnel. The aim of the study is to assess the environmental conditions during the time users have to reach the escape doors following the onset of a fire. Observations were made on how long and at what levels users would be exposed to the effects of hot smoke. The Solvent software was used for the CFD simulation. For the simulation, the tunnel was designed in three dimensions and the simulation was run by defining the necessary boundary conditions such as ambient temperature, portal pressures, fire curve, fire location, traffic information, jet fan type, jet fan locations. As a result of the simulation, the key phenomena for user evacuation, such as temperature, carbon monoxide, and visibility, were obtained as outputs. Tecplot 360 software was utilized to obtain these outputs. To evaluate environmental conditions for user evacuation holistically over time and distance, two-dimensional graphs of the results obtained from the CFD analysis were created using Matlab software. These graphs visualized the users' exposure to the effects of the fire during the evacuation process in a comprehensive manner.
Fundamentals and Purpose of Computational Fluid Dynamics
With CFD analysis, the distribution of velocity, temperature, pressure, concentration, and other parameters is calculated throughout the defined control volume during the simulation. To analyze these parameters, CFD software uses the Navier-Stokes equation, energy equation, and mass transfer equations. These equations are generally expressed in the following form.
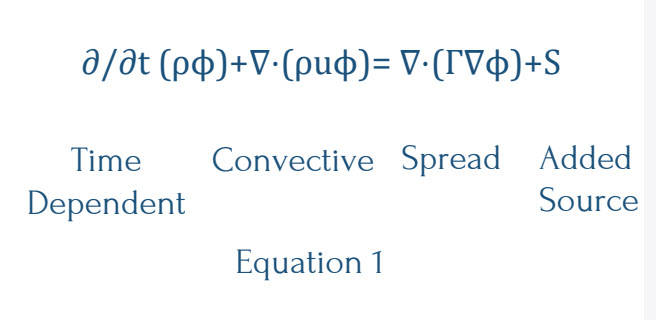
Here, ϕ represents a generalized variable (e.g., velocity component, internal energy, etc.). The terms on the left side of the equation represent the time- dependent and convective terms, respectively, while the terms on the right side represent the diffusive and externally added source terms to the system, respectively.
Since this simulation involves a fire scenario in a tunnel, the fire has been defined as the additional source in the system described in Equation 1. As a result of this fire, the heat and gases/particles released during combustion are obtained as outputs.
Depending on the nature and content of the material being burned, the combustion process produces various combustion products such as carbon monoxide (CO), carbon dioxide (CO2), sulfur dioxide (SO2), nitrogen oxides (NOx), hydrocarbons, and soot. During the combustion process, a certain amount of heat is also released based on the combustion equation, causing an increase in the ambient temperature.
Throughout the combustion process, people are directly affected by the rise in temperature, the gases produced, and the reduced visibility in the environment. Inhalation of the gases produced is considered the primary and most dangerous factor for humans. Among these gases, carbon monoxide is noted in the literature as the most harmful toxic gas that affects people. Therefore, carbon monoxide is the primary parameter to be considered in the design and control of ventilation systems. Additionally, the reduction in visibility due to the smoke in the environment slows down human movement and is thus taken into account. In this analysis, based on the levels of carbon monoxide, temperature, and visibility, the ability of people to reach the nearest escape doors in the tunnel within a sufficient amount of time during the scenario was examined.
For the CFD analysis, the tunnel geometry was first designed in a computer environment. Then, according to the requirements of the scenario being studied, the fire curve, tunnel wall material properties, pre-incident environmental conditions (density, temperature, etc.), pressure differences at the portals, traffic composition and the geometric dimensions of vehicle types, as well as the types and placement of jet fans, were defined for the simulation.
The simulation was conducted using the Solvent CFD software. SOLVENT is a Computational Fluid Dynamics (CFD) tool developed for simulating fluid flow, heat transfer, and smoke propagation in tunnels. SOLVENT was specifically designed for tunnel ventilation applications during Phase Four of the Memorial Tunnel Fire Ventilation Test Program. It has been thoroughly validated using the Memorial Tunnel fire tests.
Tunnel Information
The tunnel is designed as a single tube and has bidirectional traffic. There is traffic flow in both lanes, with one lane for outgoing traffic and the other for incoming traffic. The tunnel serves between the cities of Vlorë and Himara, with one lane heading towards Vlorë and the other lane heading towards Himara. The tunnel does not have a constant slope; there are two different slopes in the vertical cross-section of the tunnel. The geometric properties of the tunnel are shared in the table below.
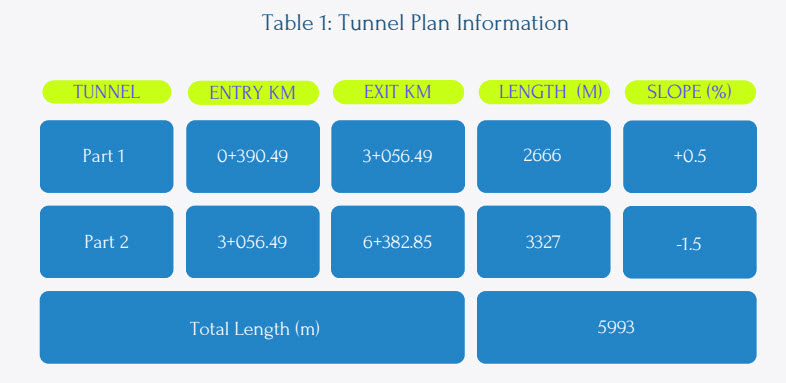
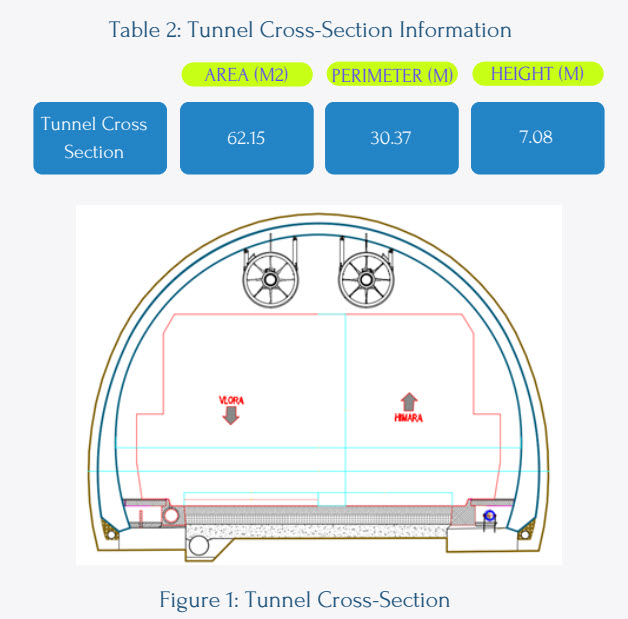
The tunnel geometry is in the shape of a horseshoe. Jet fans are positioned in pairs in the center of the ceiling of the tunnel cross-section. The tunnel cross-section and the placement of the jet fans are shown in Figure 1.
Ventilation System
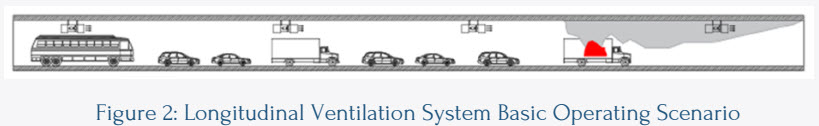
A longitudinal ventilation system with jet fans has been designed for tunnel ventilation. In longitudinal ventilation systems, the goal is to maintain sufficient air velocity in the tunnel cross-section to prevent the backflow of smoke from the fire location. This velocity is defined as the critical velocity. The critical velocity is calculated using various parameters of tunnel geometry, fire load, and environmental conditions. After determining the desired air velocity in the tunnel cross-section, calculations are made to select jet fan types and their placement along the tunnel to achieve this velocity. The design and calculations of the ventilation system are carried out within the framework of PIARC and international references.
The fact that the tunnel is bidirectional introduces several differences in system design and operational scenario compared to unidirectional tunnels.Since incident scenarios in bidirectional tunnels can be quite varied, jet fan capacities have been determined based on the worst-case scenario. For this, ventilation capacity calculations were performed, assuming vehicle presence in the negatively sloped direction and between the fire location and the entrance portals.
In bidirectional tunnels, since there is vehicle entry from portals in both directions, it is essential to protect users on both sides of the fire location from the possible effects of smoke throughout the escape process. Therefore, it is anticipated that the longitudinal ventilation systems in bidirectional tunnels will operate in two stages during a fire situation.
- Stage 1: To enable people to escape, low air velocities (averaging 1-1.5 m/s) should be maintained in the tunnel cross-section from the onset of the incident throughout the users' escape time, preventing smoke accumulation along the escape route. This approach aims to create stratification, allowing a layer of smoke to form at the ceiling of the tunnel while ensuring healthier air quality near the ground. As a result, a healthier environment is preserved for users who escape on their own.
- Stage 2: After ensuring that people have escaped from the tunnel, jet fans that were not activated in Stage 1 are brought online to achieve the calculated critical velocity or higher, facilitating the evacuation of smoke from the tunnel.
Simulation Scenario Inputs
In addition to the previously shared information about the tunnel geometry, the fire curve, traffic composition and flow, pressure differences at the tunnel portals, jet fan capacity, jet fan positioning, and the operational scenario have been defined in the simulation program. The relevant inputs are explained below in subheadings.
Fire Load and Location
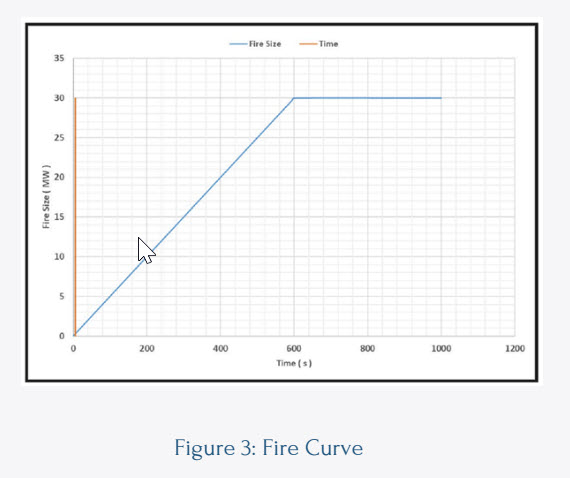
The types of vehicles within the tunnel and the amounts of loads they carry can result in very different fire loads depending on the type. For the evaluation of the system, a fire load equivalent to that of a loaded heavy commercial vehicle has been taken as 30 mW. For this purpose, the fire curve presented in Figure 9 of the CETU “Guide to Road Tunnel Safety Documentation” was used. At the start of the simulation, the fire load is 0 mW. Subsequently, it reaches a fire load of 30 mW at the 10th minute with a constant growth rate over 600 seconds. This fire curve is shown below.
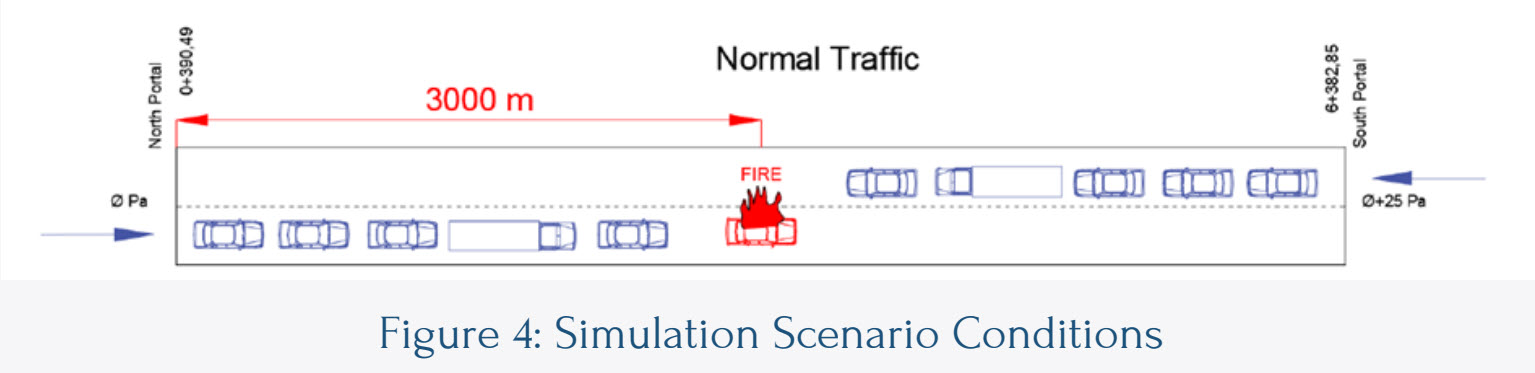
 In this scenario, it is assumed that a fire occurs in the middle of the tunnel (at 3000 m).
Location of the Escape Doors
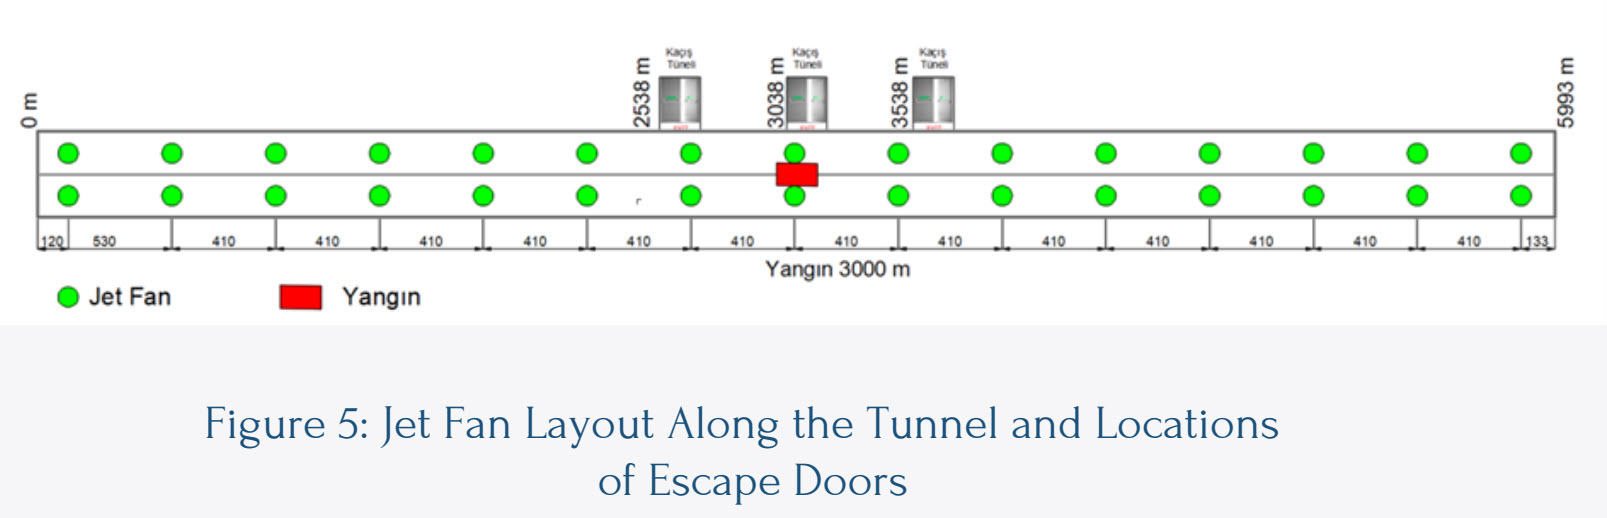
For the escape of individuals, the nearest escape doors to the fire location are located at 2538 m, 3038 m, and 3538 m from the northern entrance of the tunnel. There is a distance of 500 meters between the escape doors. It is anticipated that the escape door located at 3038 m, which is approximately in the same position as the fire location, will be unusable. The fire location and the positions of the escape doors are schematically shown in Figure 5.
Pressure Difference Between Portals
Due to wind or barometric pressures, a pressure difference can occur between the tunnel portals. In this study, a pressure difference of 25 Pa has been taken between the north portal and the south portal. Since the natural air flow created by the pressure difference in the tunnel is in the opposite direction to that of the jet fans that will be activated later, it adds additional resistance to the jet fan system.
Traffic Information
Traffic conditions in tunnels can vary seasonally, daily, and even hourly. The traffic capacity and composition change during the day, noon, or evening, which directly affects the operational needs of the ventilation system. Designs are typically made based on the worst-case scenario. Various traffic scenarios can be accepted and observed for examining operational scenarios. In this simulation, traffic data from the traffic assessment report prepared for the tunnel was used. The traffic composition has been taken as the distribution of passenger vehicles, light commercial vehicles, and heavy commercial vehicles. It is assumed that the traffic in the tunnel is flowing, and the vehicle speed for flowing traffic has been taken as 60 km/h. The traffic flow is considered to be 218 vehicles per hour per lane. The distribution of vehicle types within the tunnel is shared in the table below.
Jet Fans
The jet fans used have an inner diameter of 1250 mm and a nominal thrust force of 1450 N. The volumetric flow rate of the jet fan is 34 m³/s, and the air speed at the jet fan outlet is 35 m/s. There are a total of 30 jet fans in the tunnel, organized in 15 rows of jet fan blocks, with each row consisting of two fans. The positions of the jet fans, the fire, and the escape tunnels are shown in the visual below.
Simulation Evaluation Assumptions
As previously mentioned, this study has been evaluated based on three parameters obtained from the fire simulation results. It should be assessed how long these parameters affect individuals and how they influence user evacuation. For this purpose, the harmful effects and threshold levels of carbon monoxide, temperature, and visibility are explained below in accordance with the references SPFE and ISO/TS 21602.
- Temperature:
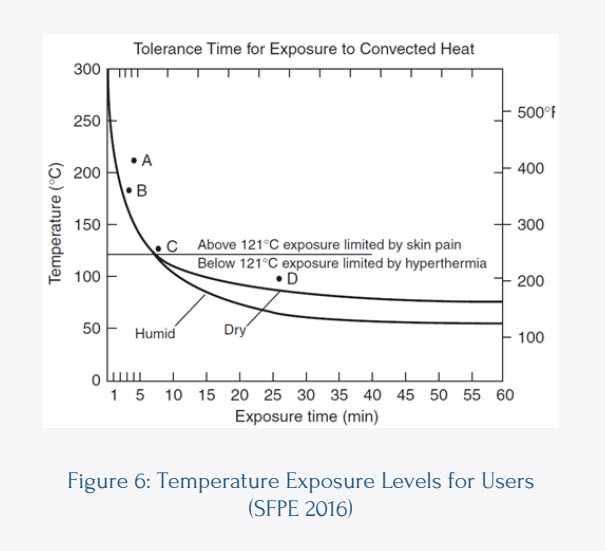 The effects of temperature on individuals vary depending on the degree of temperature. These effects may include dizziness, blurred vision, rapid heartbeat, dry skin, loss of consciousness, difficulty breathing, hypothermia, skin burns, etc. The "SFPE Handbook of Fire Protection Engineering" provides references regarding exposure times to temperature. The following graph, sourced from the same reference, indicates the durations for which users may be exposed to temperature.
- Carbon Monoxide
Carbon monoxide (CO) is a colorless, odorless, and tasteless gas. It is the most important asphyxiant gas because it is always present in high concentrations during fires. Prolonged exposure to this gas can cause confusion and loss of consciousness, making escape difficult or impossible.
When the concentration of carbon monoxide (CO) in the inhaled air increases, the gas enters the bloodstream and binds to hemoglobin molecules, which play a role in transporting oxygen, more easily than oxygen itself. This leads to the formation of carboxyhemoglobin, which prevents oxygen from being delivered to tissues and can result in cell death. Symptoms of carbon monoxide poisoning may include headaches, vision disturbances, drowsiness, confusion, and coma.
Information regarding CO concentration limits and exposure durations that can lead to an inability to continue activities (such as walking on an escape route) has been shared based on the SFPE 2016 source.
-6000-8000 ppm for 5 minutes
-1400-1700 ppm for 30 minutes
- Visibility Distance
The reduction of visibility due to smoke has two primary causes (SFPE 2016):
1.Light beams coming from the background of a sign are obstructed by smoke particles, reducing clarity as they reach a person's eyes.
2.The overall illumination from corridors or rooms is scattered towards a person's eyes by smoke particles, adding to the reduced light
flow mentioned in (1)
In tunnels, the first factor that reduces visibility significantly impacts only the escape phase. The effect of reduced visibility during the escape phase on people's escape speed is illustrated in the graph below. The following graph is referenced in ISO/TS 21602.
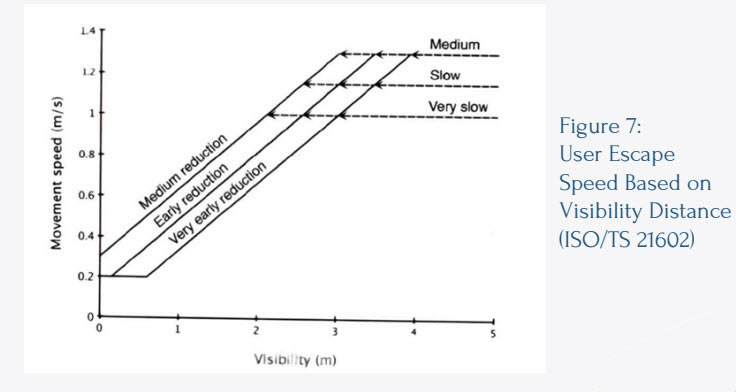 In this graph, the reduction in visibility directly affects people's escape speeds. In the worst-case scenario, it is understood that individuals can move at a speed of 1 m/s with a visibility distance of only 3 meters. As visibility decreases further, the speed at which users can move is directly reduced based on the rate at which smoke decreases visibility.
The outputs obtained from the simulation can be evaluated against this reference information. This allows for an assessment of how much users can be affected by each factor (temperature, carbon monoxide, visibility) while reaching the escape door and the potential harms associated with these effects.
Analysis Results
Assuming an average height of 1.8 m for individuals, the temperature, carbon monoxide, and visibility values at the height of 1.8 m will indicate the potential effects on an average person. Therefore, the simulation results were extracted at a height of 1.8 meters above the tunnel floor. The simulation results obtained from the Solvent HAD software were processed in Tecplot 360, and the graphs were created using MATLAB. In these graphs, temperature, carbon monoxide, and visibility values are visualized in two dimensions based on time and distance. Additionally, the positions of the nearest escape doors accessible to users and their anticipated escape speeds are also shown.
If individuals could move at a constant speed of 1 m/s, their movement over time in relation to distance is represented by a yellow line in the graphs. However, as visibility decreases in areas with dense smoke, escape speeds also decline. Thus, a more realistic escape movement is indicated by a blue line. In areas with less smoke, the escape speed is 1 m/s, while in heavily smoked areas, it is 0.8 m/s. This escape movement is depicted in the temperature, carbon monoxide, and visibility graphs, allowing for an assessment of how much and for how long users are exposed to each factor along their escape route.
The graphs showing the results of temperature, carbon monoxide, and visibility obtained from the analysis are shared below.
Temperature
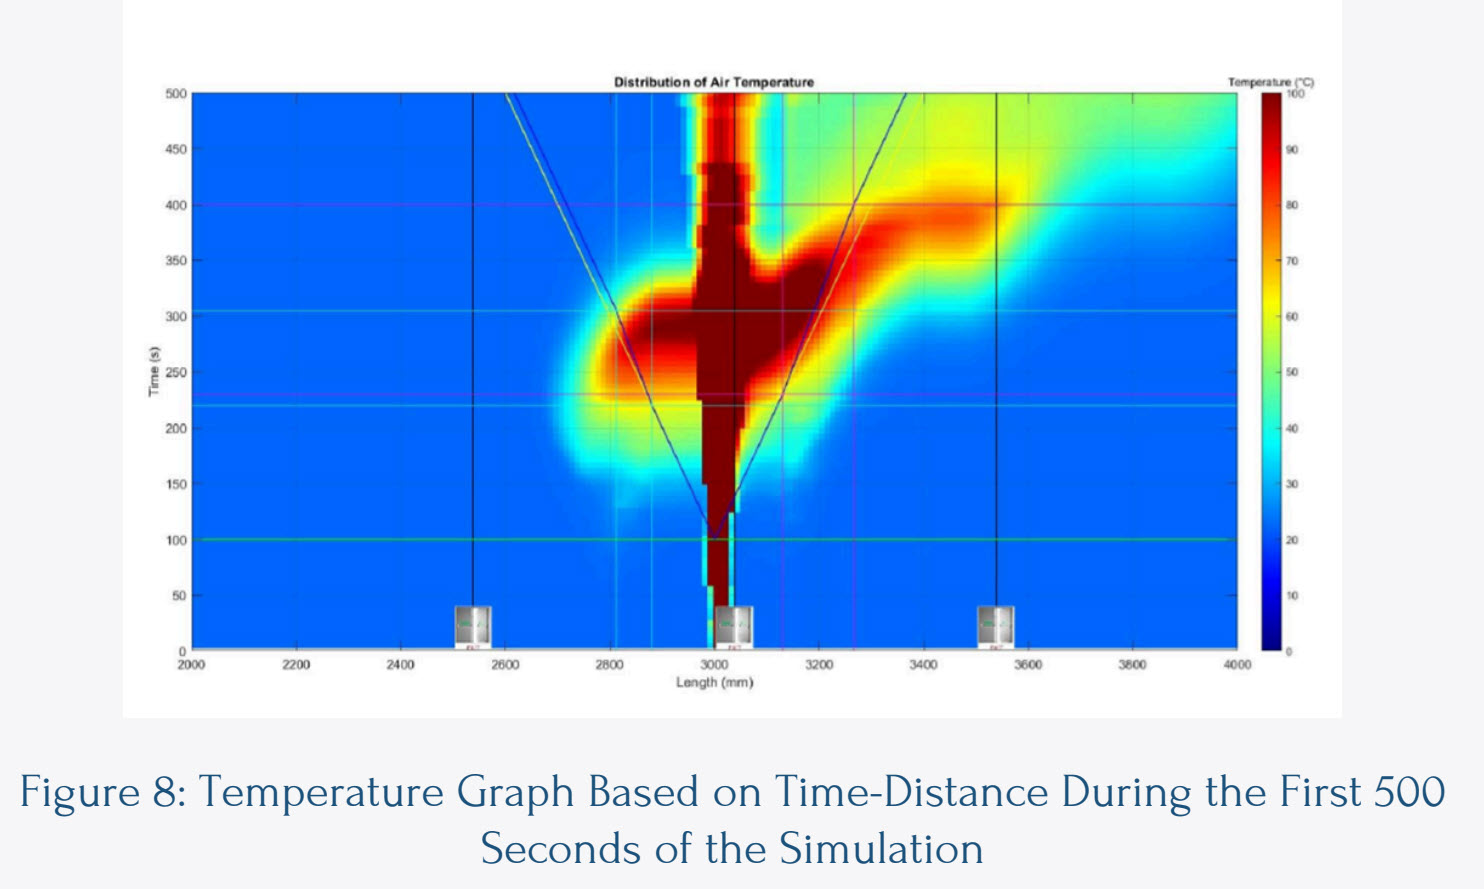
In the simulation results, the temperature indicator is set to visualize values between 0-100°C. Therefore, temperature variations that may affect individuals, depending on the fire location, can be observed at distances to the escape doors in front of and behind the fire. The black vertical lines in the graph indicate the positions of the escape doors.
The movement of individuals escaping at a speed of 1 m/s is represented by the yellow lines in the graph.
A user retreating from the fire location (3000 meters) reaches a distance of 2880 meters in 222 seconds. During this time, the temperature does not pose a problem for the users.
- The average temperature between 2880 meters and 2848 meters is approximately 74°C, and this stage is traversed in about 40 seconds.
- The average temperature between 2848 meters and 2818 meters is approximately 73°C, and this stage is traversed in about 41 seconds.
- The temperature between 2818 meters and the escape door (2538 meters) is not at a disturbing level.
A user moving forward from the fire location (3000 meters) reaches 3133 meters in 232 seconds. During this time, the temperature does not pose a problem for users.
- The average temperature between 3133 meters and 3154 meters is approximately 67°C, and this stage is traversed in about 25 seconds.
- The average temperature between 3154 meters and 3205 meters is approximately 88°C, and this stage is traversed in about 65 seconds.
- The average temperature between 3205 meters and 3255 meters is approximately 84°C, and this stage is traversed in about 35 seconds.
- The average temperature between 3255 meters and 3266 meters is approximately 65°C, and this stage is traversed in about 40 seconds.
- The temperature between 3266 meters and the escape door is below 57°C.
According to SFPE 2016, a person can withstand temperatures of up to 70°C for up to 60 minutes. All temperatures mentioned here are below 100°C, and the exposure duration to temperatures of 70°C and above is approximately 100 seconds. Therefore, since the temperatures along the escape route remain below 70°C, serious adverse effects from high temperatures are not anticipated. In the event of a fire, it appears feasible for individuals to escape safely in terms of temperature exposure and duration along the escape routes.
Carbon Monoxide
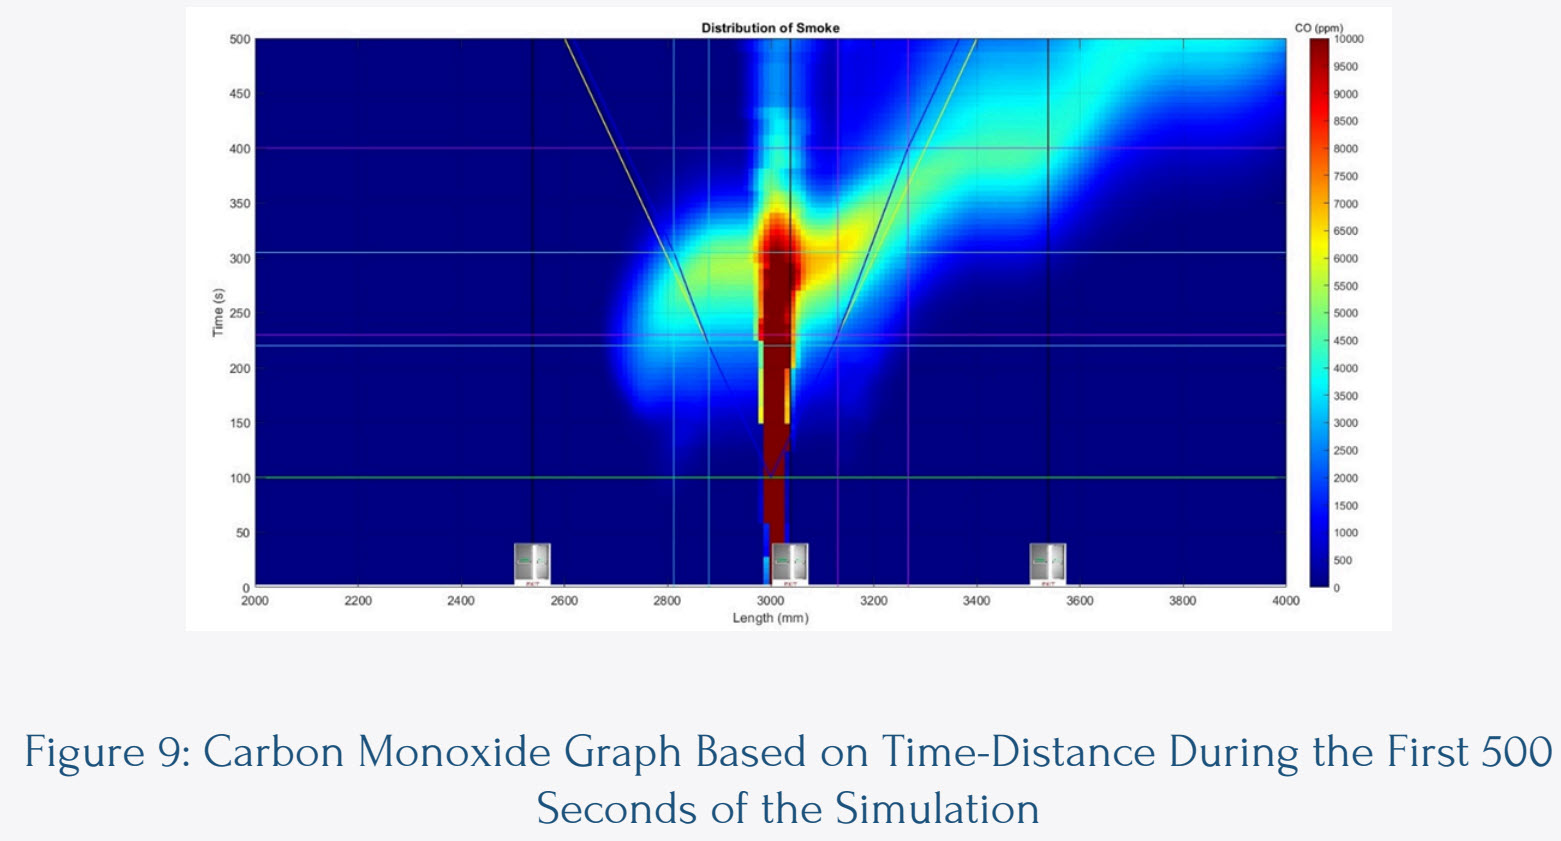
When examining the carbon monoxide (CO) distribution in Figure 9, it is observed that the effective threshold values for human exposure to CO range from 6000 to 8000 ppm for a duration of 5 minutes. Therefore, the CO scale in the graph is shown between 0 and 10,000 ppm. The black vertical lines in the graph indicate the locations of the escape doors. The escape of individuals at a speed of 1 m/s is represented by the yellow lines in the graph. The user escaping from the fire position at a distance of 3000 meters reaches 2880 meters in 217 seconds. During this time, the CO levels do not pose a serious threat to users.
- The average CO value from 2880 meters to 2838 meters is approximately 3885 ppm, and this phase takes about 55 seconds to traverse.
- The average CO value from 2838 meters to 2818 meters is approximately 4070 ppm, and this phase takes about 30 seconds to traverse.
- The CO levels from 2818 meters to the escape door at 2538 meters do not present a significant threat.
The user escaping forward from the fire position at a distance of 3000 meters reaches 3123 meters in 232 seconds. During this time, the CO levels do not pose a serious threat to users
- The average CO value from 3123 meters to 3164 meters is approximately 3334 ppm, and this phase takes about 40 seconds to traverse.
- The average CO value from 3164 meters to 3205 meters is approximately 4647 ppm, and this phase takes about 50 seconds to traverse.
- The average CO value from 3205 meters to 3235 meters is approximately 4861 ppm, and this phase takes about 40 seconds to traverse.
- The average CO value from 3235 meters to 3255 meters is approximately 3987 ppm, and this phase takes about 25 seconds to traverse.
- The average CO value from 3255 meters to 3266 meters is approximately 3403 ppm, and this phase takes about 10 seconds to traverse.
- ·The average CO value from 3266 meters to 3367 meters is approximately 2691 ppm, and this phase can be traversed in about 103 seconds.
- ·The CO concentration between 3367 meters and the escape door is below 2115 ppm
According to SFPE 2016, individuals can be exposed to a maximum of 6000- 8000 ppm CO for up to 5 minutes. Additionally, they can tolerate exposure to 1400-1700 ppm CO for up to 30 minutes. Based on these values and exposure durations, individuals can manage to escape. In light of this information, it can be concluded that during an incident, the CO levels and exposure durations individuals will encounter along escape routes allow for safe individual evacuation.
Visibility Distance
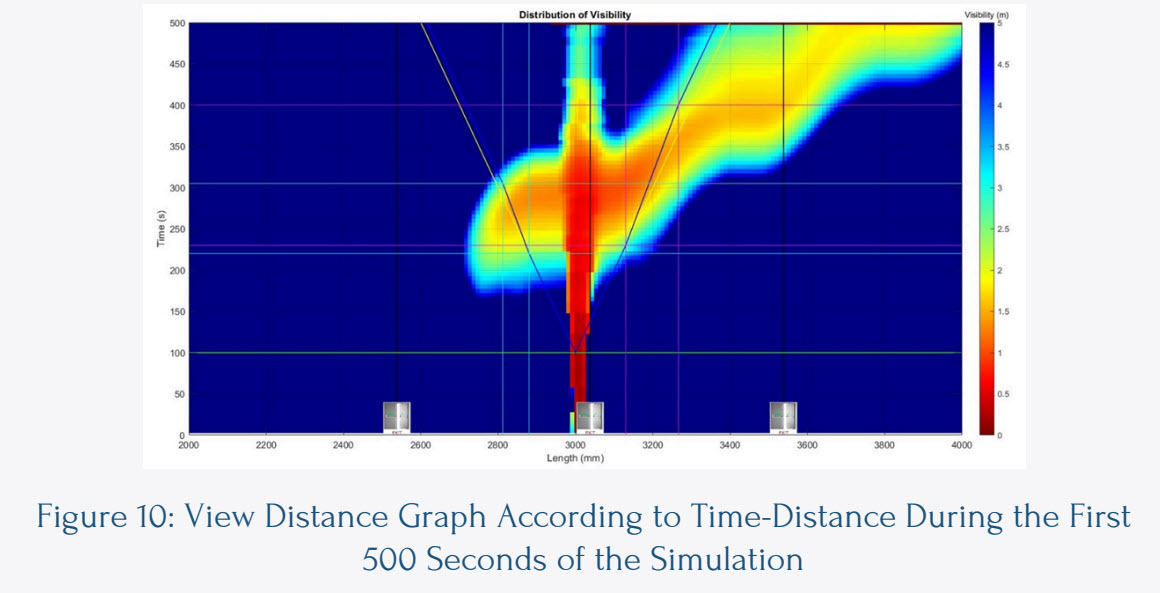
The visibility distance in the environment is the most significant factor affecting people's escape speed. In routes where visibility distance decreases significantly and is at a minimum of 3 meters or more, the escape speed is considered to be 1 m/s. The black vertical lines in the graph indicate the positions of the escape doors. The escape of individuals at a speed of 1 m/s is represented by yellow lines in the graph.
The blue line indicates the following phases:
- First Phase: Individuals escape at a speed of 1 m/s.
- Second Phase: Individuals escape at a speed of 0.8 m/s.
- Third Phase: Individuals escape again at a speed of 1 m/s.
A user escaping from a fire position 3000 meters back reaches 2879 meters in 220 seconds. During this time, the decreasing visibility distance does not pose a significant threat to users. The average visibility distance in this period is more than 3 meters, allowing the escape speed to be considered 1 m/s.
- From 2879 meters to 2818 meters, the average visibility distance is approximately 2.00 meters, and this phase is completed in about 85 seconds. Given the average visibility distance of around 2 meters during this period, the escape speed is taken as 0.8 m/s.
- From 2818 meters to the escape door at 2538 meters, the visibility distance does not present a significant threat to users’ escape.
For a user escaping forward from the fire position 3000 meters back, they reach 3133 meters in 230 seconds. During this period, the visibility distance remains generally above 3 meters, and the decreasing visibility does not pose a significant threat to users.
- From 3133 meters to 3266 meters, the average visibility distance is approximately 1.75 meters, and this phase is completed in about 170 seconds. The escape speed is considered to be 0.8 m/s.
- From 3266 meters to 3368 meters, the average visibility distance is approximately 2.80 meters, and this phase is completed in about 100 seconds. The escape speed is considered to be 1 m/s.
Taking into account the visibility distances and the durations users are exposed, it can be concluded that all users can be evacuated without suffering serious harm.